|
|
 |
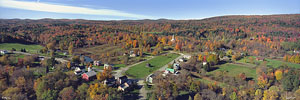
Westford: July 26, 2026
LOCAL CLIMATOLOGICAL DATA
Hourly Summary
July 26, 2026

Station: Westford
Latitude: 44° 37' 38" N
Longitude: 73° 02' 30" W
Elevation (ground): 850 ft.
Time Zone: Eastern

+--+------------------------+----+-----+--------------------+------------------------+------+
|  |       Temperature      |    | Pre-|      Pressure      |           Wind         |Solar |
|  +------+------+------+---+ Hu-|cipi-|  Adj. to Sea Level +----+---+-------+-------+------+
|  |   M  |   M  |      |   |mid-| ta- +------+------+------+ Avg|Res| Peak  |2Minute| Mean |
|  |   a  |   i  |      | D | ity| tion|      |      |      |    |   +---+---+---+---+   W  |
|  |   x  |   n  |      | e |    |     |      |      |      |  S |   | S |   | S |   |   a  |
| H|   i  |   i  |   M  | w |  M |     |      |      |   M  |  p |   | p |   | p |   |   t  |
| o|   m  |   m  |   e  |   |  e |Water|   M  |   M  |   e  |  e | D | e | D | e | D |   t  |
| u|   u  |   u  |   a  | P |  a |     |   a  |   i  |   a  |  e | i | e | i | e | i |   s  |
| r|   m  |   m  |   n  | t |  n |Equiv|   x  |   n  |   n  |  d | r | d | r | d | r |  m²  |
|  |      |      |      |   |    |     |      |      |      |    |   |   |   |   |   |      |
| 1|   2  |   3  |   4  | 5 |  6 |  7  |   8  |   9  |  10  | 11 | 12| 13| 14| 15| 16|  17  |
+--+------+------+------+---+----+-----+------+------+------+----+---+---+---+---+---+------+
|00| 60.6 | 59.8 | 60.2 | 57|  88| 0.00| 29.91| 29.90|29.906| 0.0|223|  2| SW|  0|223|    0 |
|01| 59.8 | 59.5 | 59.6 | 56|  89| 0.00| 29.90| 29.89|29.897| 0.0|223|  0| SW|  0|223|    0 |
|02| 60.7 | 59.5 | 59.9 | 57|  90| 0.00| 29.89| 29.88|29.886| 0.0|223|  4| SW|  1|223|    0 |
|03| 60.9 | 60.5 | 60.7 | 57|  87| 0.00| 29.88| 29.88|29.879| 0.0|222|  4| SW|  0|221|    0 |
|  |      |      |      |   |    |     |      |      |      |    |   |   |   |   |   |      |
|04| 60.8 | 60.0 | 60.5 | 57|  87| 0.00| 29.88| 29.87|29.875| 0.1|219|  4| SW|  0|223|    0 |
|05| 60.0 | 58.9*| 59.4 | 56|  88| 0.00| 29.88| 29.87|29.877| 0.1|202|  3|SSW|  1|203|    2 |
|06| 60.4 | 58.9 | 59.5 | 56|  89| 0.00| 29.89| 29.88|29.884| 0.1|199|  4|SSW|  1|200|   30 |
|07| 68.5 | 60.4 | 63.4 | 59|  87| 0.00| 29.89| 29.89|29.887| 0.2|196|  4|  S|  1|197|  149 |
|  |      |      |      |   |    |     |      |      |      |    |   |   |   |   |   |      |
|08| 75.5 | 68.5 | 72.5 | 64|  74| 0.00| 29.89| 29.88|29.882| 0.5|185|  6|  S|  2|184|  372 |
|09| 78.6 | 75.5 | 76.9 | 65|  67| 0.00| 29.88| 29.86|29.869| 0.6|171|  7|SSE|  2|170|  532 |
|10| 81.0 | 78.5 | 79.5 | 66|  64| 0.00| 29.86| 29.85|29.858| 0.9|195|  7| SW|  4|239|  670 |
|11| 83.8 | 80.9 | 82.3 | 66|  58| 0.00| 29.85| 29.84|29.844| 1.0|168|  9| SW|  3|186|  778 |
|  |      |      |      |   |    |     |      |      |      |    |   |   |   |   |   |      |
|12| 85.3*| 83.6 | 84.5 | 65|  52| 0.00| 29.84| 29.82|29.830| 1.3|207|  8|ESE|  4|231|  854 |
|13| 85.1 | 81.2 | 83.2 | 66|  57| 0.00| 29.82| 29.80|29.808| 0.5|211|  5|SSE|  3|203|  405 |
|14| 81.3 | 78.5 | 79.8 | 68|  68| 0.00| 29.80| 29.78|29.793| 0.2|223|  5|WSW|  3|245|  242 |
|15| 83.2 | 79.6 | 80.8 | 67|  62| 0.00| 29.79| 29.77|29.781| 0.7|202|  7|  S|  3|177|  462 |
|  |      |      |      |   |    |     |      |      |      |    |   |   |   |   |   |      |
|16| 85.1 | 83.2 | 84.3 | 66|  54| 0.00| 29.77| 29.76|29.763| 1.8|217| 10|  W|  5|255|  588 |
|17| 85.0 | 81.6 | 83.9 | 66|  55| 0.00| 29.76| 29.76|29.759| 1.3|228| 10|  S|  5|265|  402 |
|18| 81.7 | 78.6 | 80.6 | 65|  59| 0.00| 29.77| 29.76|29.761| 0.5|165|  6|SSE|  3|161|  160 |
|19| 78.7 | 71.0 | 74.7 | 64|  70| 0.00| 29.77| 29.76|29.771| 0.2|168|  7|  S|  1|173|   31 |
|  |      |      |      |   |    |     |      |      |      |    |   |   |   |   |   |      |
|20| 71.0 | 66.8 | 68.2 | 62|  80| 0.00| 29.78| 29.77|29.771| 0.0|135|  1| SE|  0|135|    2 |
|21| 66.9 | 65.4 | 66.6 | 61|  82| 0.00| 29.78| 29.77|29.781| 0.0|136|  3| SE|  0|136|    0 |
|22| 65.4 | 62.1 | 63.5 | 59|  85| 0.00| 29.78| 29.78|29.781| 0.0|136|  0| SE|  0|136|    0 |
|23| 62.1 | 60.5 | 61.2 | 58|  88| 0.00| 29.78| 29.77|29.775| 0.0|136|  0| SE|  0|136|    0 |
+--+------+------+------+---+----+-----+------+------+------+----+---+---+---+---+---+------+
   | ---- | ---- | ---- | - | -- |Total|                For the day:                 | ---- |
   +------+------+------+---+----+-----+------+------+------+----+---+---+---+---+---+------+
   | ---- | ---- | ---- | - | -- | 0.00| 29.91| 29.76|29.830| 0.4|201| 10|  W|  5|265| ---- |
   +------+------+------+---+----+-----+------+------+------+----+---+---+---+---+---+------+
   |     Avg     | Mean |Avg| Avg|Month| Hour | Hour | ---- | -- | - |  Hour |  Hour |  Avg |
   +-------------+------+---+----+-----+------+------+------+----+---+-------+-------+------+
   |     72.1    | 71.1 | 62|74.2| 1.63|   0  |  17+ | ---- | -- | - |   16+ |   17  | 236.7|
   +-------------+------+---+----+-----+------+------+------+----+---+----+--+---+---+------+
   | Total Snow,        |                                   |             |      |  Heat   0|
   | Ice Pellets        | Greatest Depth on Ground          | Precip Types|Degree+----------+
   |                0.0 | of Snow, Ice Pellets or Ice     0 |  .........  | Days |  Cool   7|
   +--------------------+-----------------------------------+-------------+------+----------+

  NOTES:
   Data in columns 4, 5, 6, 10, 11, 17 are means via continuous observations for each hour.
   Units: Temperature=°F, Wind=mph, Pressure=Inches Hg, Precipitation=inches.
   Column 5: Dew point is calculated from temperature and humidity and is continuously averaged for each hour.
   Column 12: Resultant wind is calculated by the vector sum of continuous wind observations.
   Precipitation types:
     1 FOG, 2 HEAVY FOG, 3 THUNDER, 4 ICE PELLETS, 5 HAIL, 6 GLAZE, 7 DUSTSTORM,
     8 SMOKE/HAZE, 9 BLOWING SNOW.
   Degree Days heating base is 65°F, cooling base is 65°F.
|
 |
Current Radar Loop:
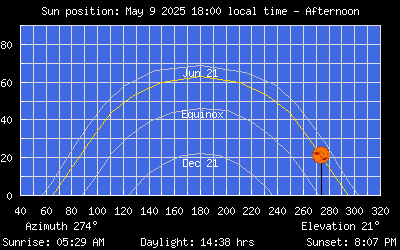
Sun Position
|
|